
Savannah Area Real Estate Market Update: What You Need to Know (February 2025)
Savannah Area Real Estate Market Update: What You Need to Know
If the Savannah-area real estate market were a roller coaster, we'd say it has some interesting twists and turns! From rising home prices to shifts in inventory, there's plenty to talk about. Let's break down what's happening in our local market with the latest year-over-year stats.
Savannah: More Homes, Higher Prices
New Listings: 320 (+31.7%)
Pending Sales: 191 (-0.5%)
Closed Sales: 184 (-4.7%)
Days on Market: 71 (+22.4%)
Median Sales Price: $390,000 (+9.6%)
Average Sales Price: $570,258 (+39.7%)
% of Original Sales Price Received: 95.6% (-0.9%)
Total Homes for Sale: 789 (+65.1%)
Months of Supply: 3.3 months (+65.0%)
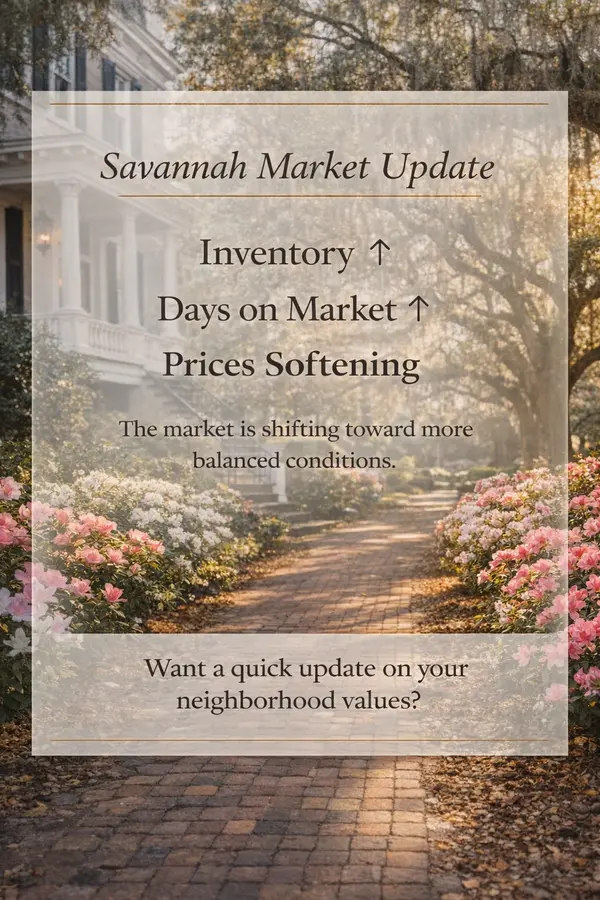
With more homes on the market and prices climbing, buyers have more options but should still be prepared to act fast. Sellers, pricing competitively is key!
Pooler: Market Cooling but Holding Value
New Listings: 57 (-26.9%)
Pending Sales: 22 (-50.0%)
Closed Sales: 23 (-41.0%)
Days on Market: 58 (+52.6%)
Median Sales Price: $419,000 (8.8%)
Average Sales Price: $444,599 (+0.9%)
% of Original Price Received: 98.0% (+0.5%)
Homes for Sale: 139 (+16.8%)
Months of Inventory: 3.2 (+68.4%)
With fewer new listings and pending sales, Pooler is slowing down, but home values are holding strong.
Bloomingdale: Fewer Sales, More Inventory
New Listings: 11 (-62.1%)
Pending Sales: 6 (-76.9%)
Closed Sales: 3 (-83.3%)
Days on Market: 56 (+33.3%)
Median Sales Price: $360,000 (+4.3%)
Average Sales Price: $391,667 (+10.9%)
% of Original Price Received: 97.6% (-1.3%)
Homes for Sale: 43 (+87.0%)
Months Supply: 3.9 (+178.6%)
Bloomingdale has seen a big drop in transactions, but inventory is growing. Buyers, this could mean more room for negotiations!
Richmond Hill: Prices Up, Sales Down
New Listings: 76 (-22.4%)
Pending Sales: 51 (-30.1%)
Closed Sales: 45 (-8.2%)
Days on Market: 69 (+56.8%)
Median Sales Price: $469,990 (+6.8%)
Average Sales Price: $501,844 (+5.4%)
% of Original Price Received: 97.0% (-1.3%)
Homes for Sale: 240 (+81.8%)
Months of Supply: 3.5 (+94.4%)
While demand has softened, home values in Richmond Hill continue to rise.
Rincon: Slower Sales, Longer Market Time
New Listings: 29 (-43.1%)
Pending Sales: 30 (-41.2%)
Closed Sales: 22 (-52.2%)
Days on Market: 95 (+171.4%)
Median Sales Price: $332,995 (+15.6%)
Average Sales Price: $380,057 (+8.8%)
% of Original Price Received: 97.0% (-1.2%)
Homes for Sale: 86 (+22.9%)
Months of Supply: 2.4 (+60.0%)
Rincon's market has slowed, but home values continue their upward trend.
Guyton: Market Heating Up
New Listings: 54 (+63.6%)
Pending Sales: 23 (-25.8%)
Closed Sales: 25 (+78.6%)
Days on Market: 84 (+40.0%)
Median Sales Price: $389,990 (+9.9%)
Average Sales Price: $399,142 (+12.5%)
% of Original Price Received: 96.2% (+0.5%)
Homes for Sale: 138 (+146.4%)
Months of Supply: 3.9 (+160.0%)
Guyton is seeing a rise in new listings and closed sales, signaling an active market.
Hinesville: Steady but Tight Market
New Listings: 42 (-41.7%)
Pending Sales: 29 (-45.3%)
Closed Sales: 32 (-17.9%)
Days on Market: 48 (-22.6%)
Median Sales Price: $265,450 (+4.1%)
Average Sales Price: $268,675 (+3.2%)
% of Original Price Received: 99.9% (-0.3%)
Homes for Sale: 90 (-26.8%)
Months of Supply 1.7 (-15.0%)
Hinesville remains competitive with high list price retention and low inventory.
What Does This Mean for You?
Buyers: More inventory means more choices, but higher prices and rising days on market may suggest some opportunities to negotiate.
Sellers: Pricing your home correctly is crucial. Overpricing could leave your home sitting longer in today's market.
Investors: The increase in inventory and fluctuating demand make this an interesting time to explore opportunities.
Thinking about buying or selling? Let's chat about how these trends may impact you.
Categories
Recent Posts


GET MORE INFORMATION